Schools
One in Four Marengo Students Was Chronically Absent in the 2024-25 School Year. Six Years Earlier It Was One in Eight.
The short version: Before the pandemic, both Marengo school districts had lower rates of chronic absenteeism than Illinois as a whole. In the most recent state data, both are higher. We asked all three districts serving the area what changed. None of them said the counting did.
Monday, September 28, 2026
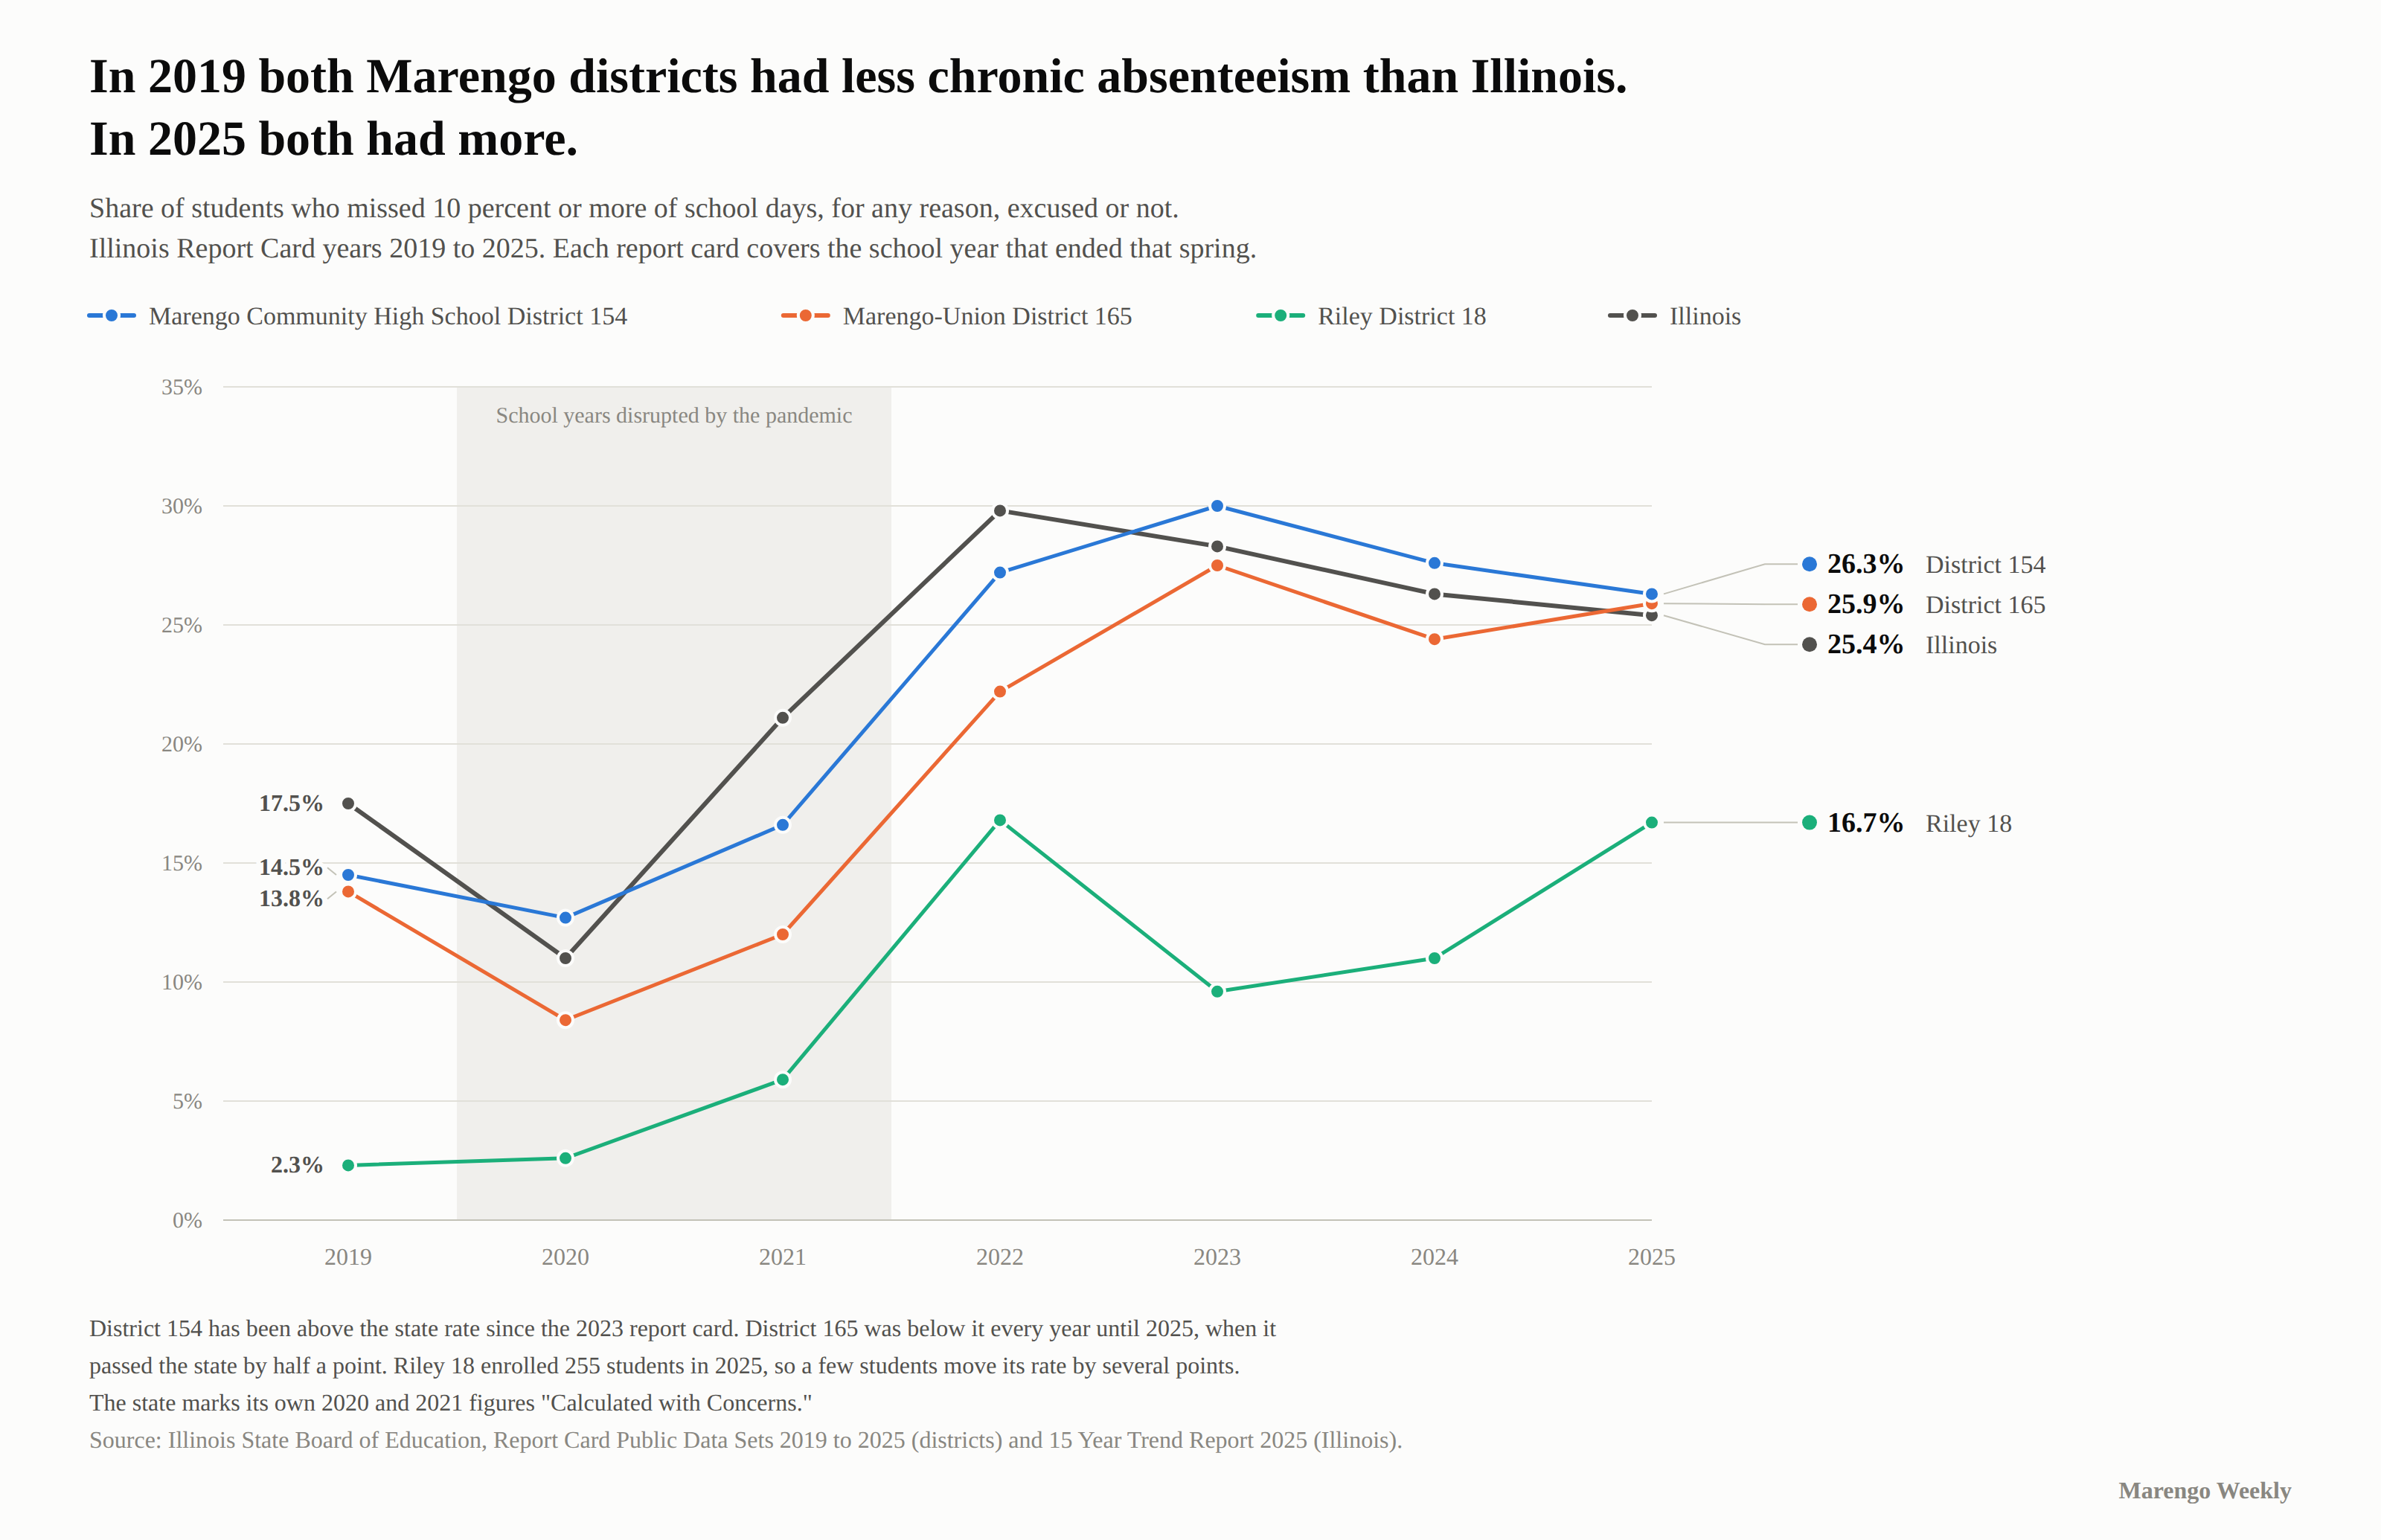
Illinois counts a student as chronically absent when the student misses 10 percent or more of the school year, for any reason. Excused absences count. Unexcused absences count. Out-of-school suspensions count. In a 180-day year, the line is 18 days.
In the 2019 state report card, which covers the 2018-19 school year, the last full one before the pandemic, the three districts serving Marengo had about 250 students over that line, one in eight. In the 2025 report card, which covers 2024-25 and is the most recent the state has published, they had about 500, one in four.
The rate rose statewide. What is different about Marengo is where its two districts started and where they ended up.
The Crossover
In 2019, Marengo Community High School District 154 had a chronic absenteeism rate of 14.5 percent and Marengo-Union Elementary Consolidated District 165 had 13.8 percent. The state average was 17.5. Both Marengo districts were better than Illinois.
In 2025, District 154 was at 26.3 percent and District 165 at 25.9. The state average was 25.4. Both Marengo districts were worse than Illinois.
| 2019 | 2025 | |
|---|---|---|
| Marengo CHSD 154 | 14.5% | 26.3% |
| Marengo-Union D165 | 13.8% | 25.9% |
| Riley CCSD 18 | 2.3% | 16.7% |
| Illinois | 17.5% | 25.4% |
Chronic absenteeism, Illinois Report Card. Each report card covers the school year that ended that spring.
Statewide, the rate rose 7.9 points over those six years. District 154's rose 11.8 points and District 165's rose 12.1. Both started below the state and rose further.
The crossing did not happen all at once, and the year-by-year figures are less tidy than the endpoints. District 154 has been above the state rate since the 2023 report card, by a margin that has narrowed each year, from 1.7 points to 0.9. District 165 stayed below the state through 2024 and passed it in 2025, by half a point, in a year when the state's rate fell and the district's rose. The state's rate peaked at 29.8 percent in 2022 and has come down three years running. District 154's peaked a year later, at 30.0, and has come down since. District 165's has not settled in one direction.
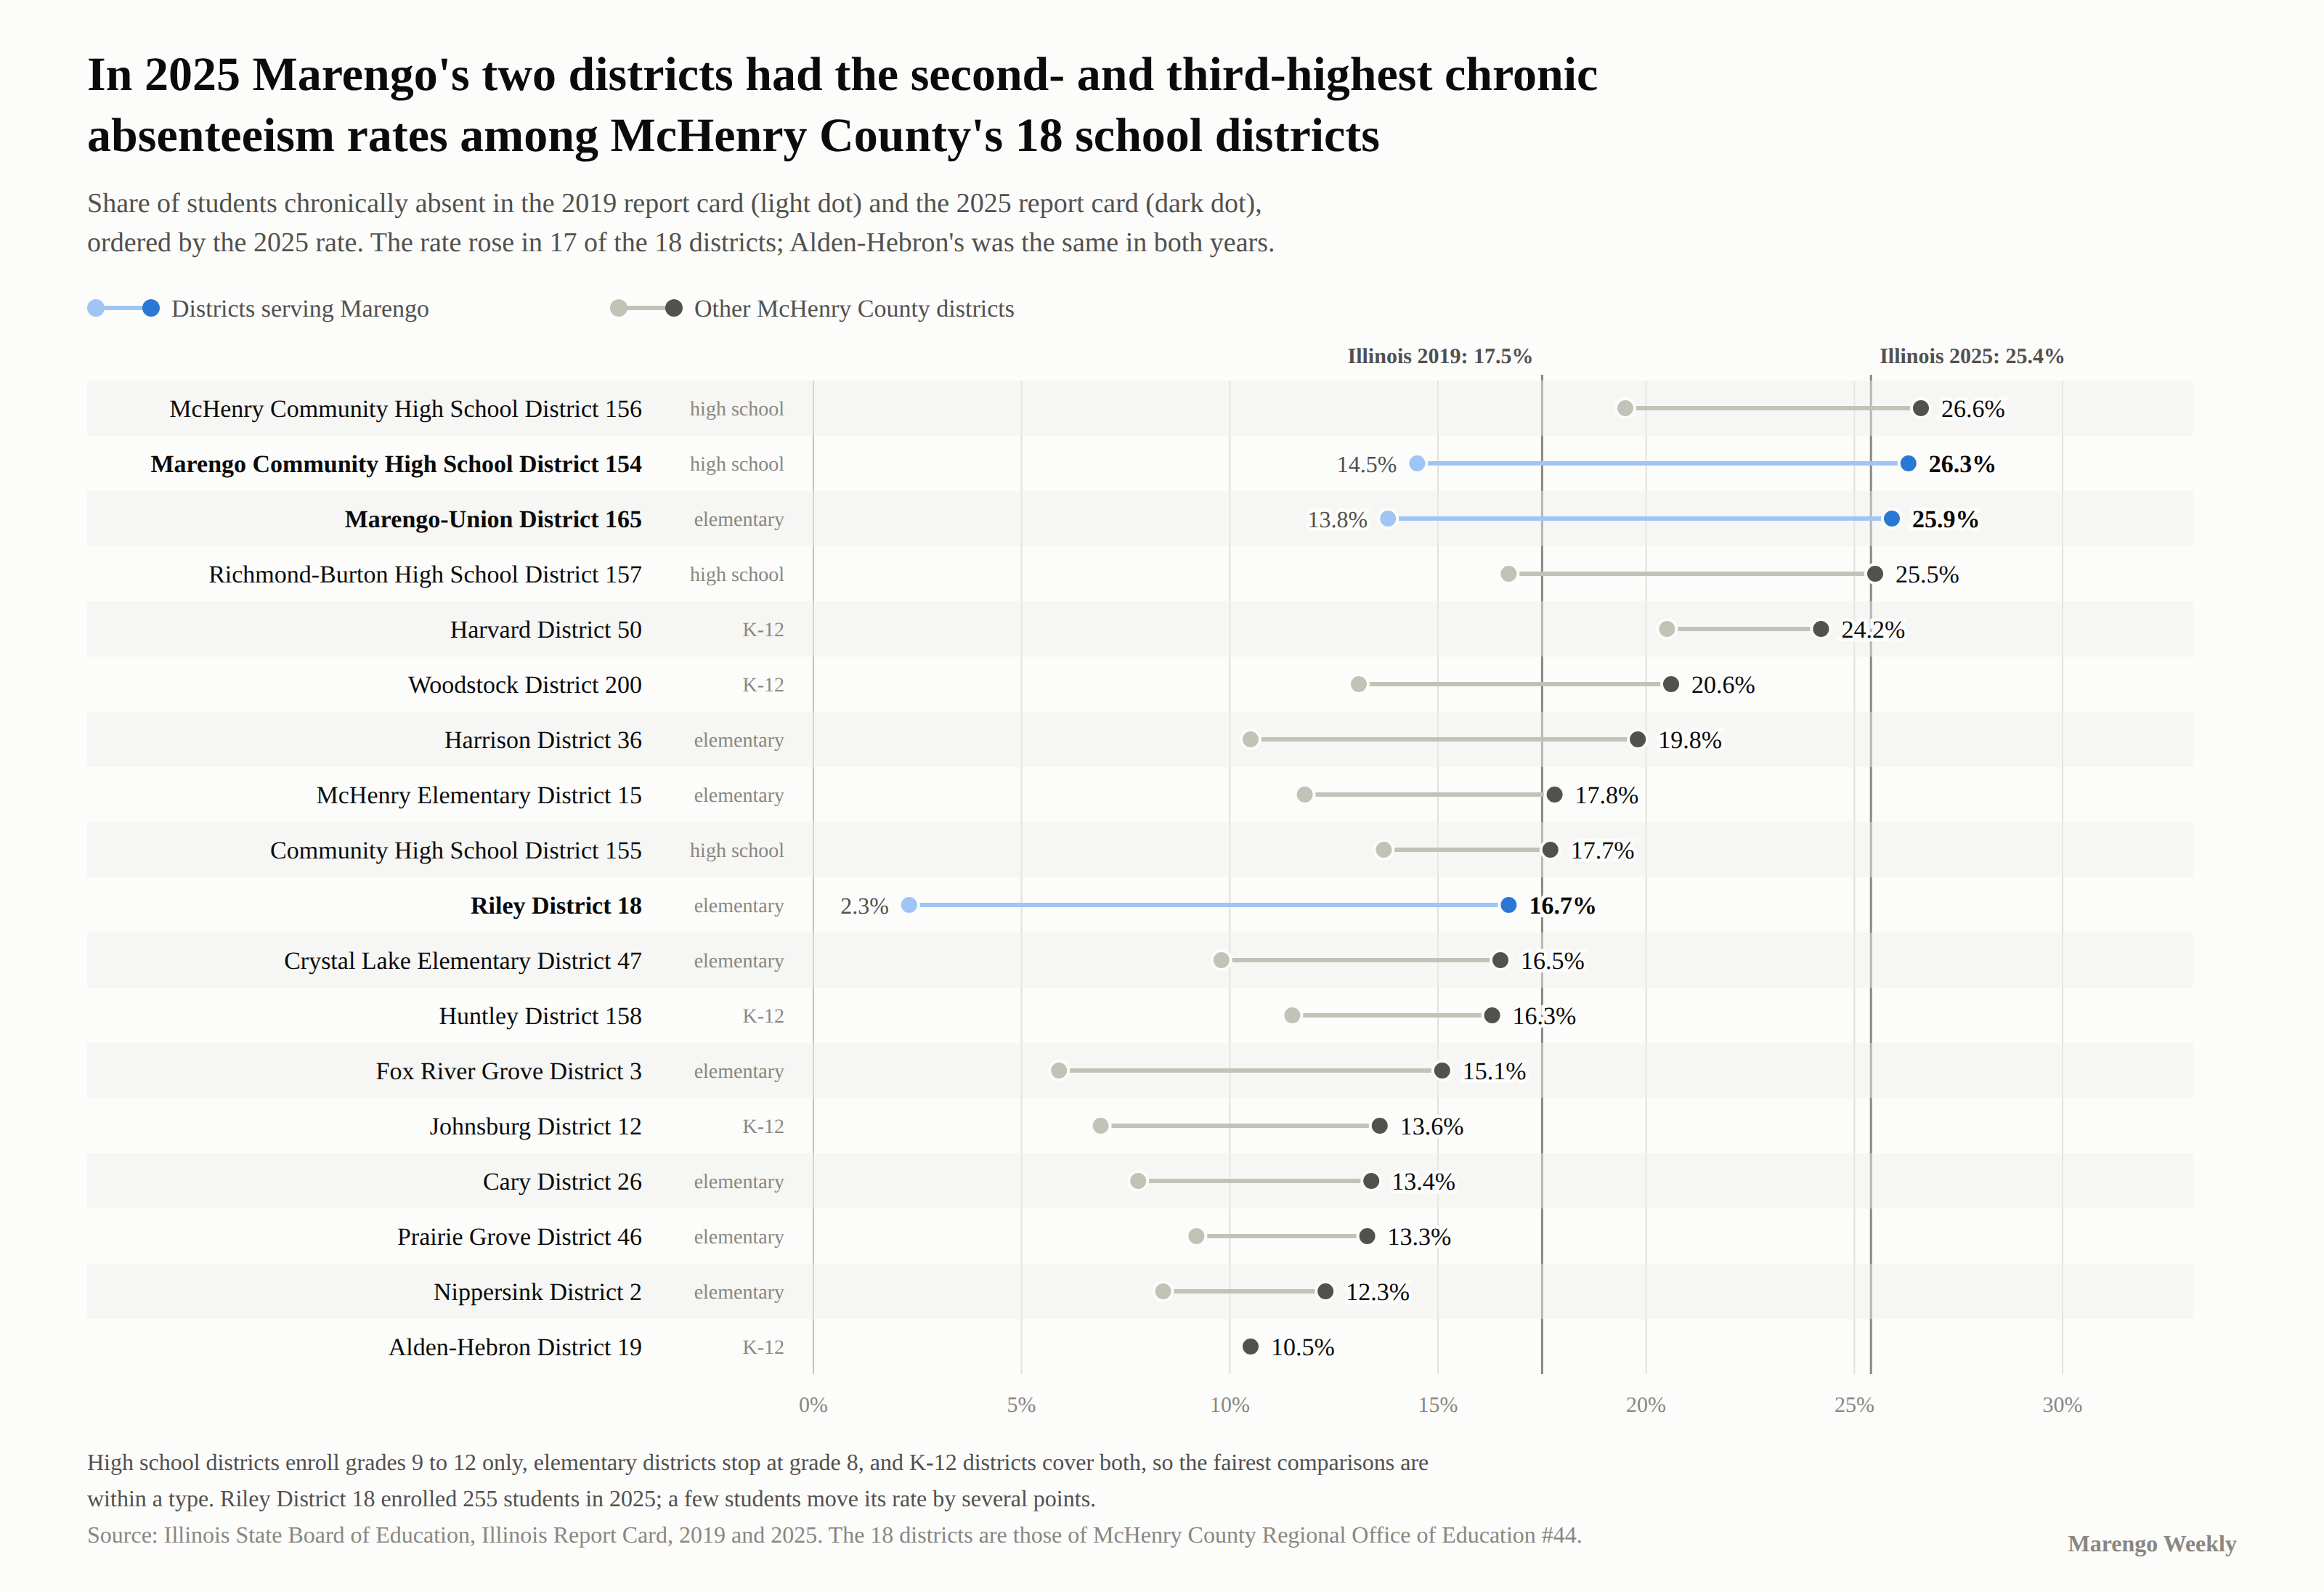
Among the eighteen school districts in McHenry County, District 154 had the second-highest chronic absenteeism rate in 2025 and District 165 the third-highest. In 2019 they were fourth and fifth. The districts nearest them on the 2025 list are McHenry Community High School District 156 at 26.6 percent, Richmond-Burton at 25.5 and Harvard at 24.2. Woodstock was at 20.6, and Huntley, the county's largest district, at 16.3. Three of the four districts at the top of the 2025 list are high schools. District 165 is the exception: its rate is the highest among the county's nine elementary districts.
Three Measures That Agree
Chronic absenteeism is one number, and one number can mislead. So we checked it against two others the state calculates separately, and both moved the same way.
Average daily attendance, the share of enrolled students in the building on a typical day, fell in all three districts: District 154 from 94.9 percent to 92.0, District 165 from 94.8 to 92.5, Riley from 96.1 to 94.4. Those look like small moves. They are not. A district at 92 percent attendance has, on an average day, one student in twelve not there.
Chronic truancy is a different legal test. It counts only absences without a valid cause, and its line is 5 percent of the year, about nine days. It rose too: District 154 from 7.9 percent to 15.3, District 165 from 8.1 to 11.9, Riley from 2.7 to 5.8.
The truancy numbers are worth holding next to the absenteeism ones. At District 154, chronic absenteeism rose by 11.8 points and chronic truancy by 7.4. At District 165, absenteeism rose 12.1 points and truancy 3.8. The two measures count students over two different lines, so one cannot simply be subtracted from the other. But truancy, the measure that counts only absences without a valid cause, rose less than absenteeism in all three districts. That is consistent with a good share of the added absences being excused ones: illness, appointments, family reasons, a parent's call to the office. It is also what the superintendents' answers turn out to be about.
Is the Count Itself Different?
The first thing to rule out is that the state changed how it counts, or the districts changed how they code, and no more children are actually missing school. We asked each district that question directly, and offered it as the honest alternative.
None of them said it had, and District 165 ruled it out in terms.
"Our internal attendance records are consistent with what is reported on the State Report Card," District 165 Superintendent Lea Damisch wrote. "The increase is not the result of a reporting or coding change; we are actually recording more student absences. More students are being called out of school, and individual students are accumulating more days absent over the course of the year." The district has not changed its student information system and continues to report under the state's definitions.
At District 154, Assistant Principal Pete Byrne wrote that the district records attendance in three codes, present, absent excused and absent unexcused, and that the chronic absenteeism measure has not changed since 2018. (The state's definition comes from a 2017 law, and districts began collecting the data under it on July 1, 2018.) Riley 18 Superintendent Jason Grey did not take up the coding question, and wrote that "the attendance data is correct and reflects what we reported to the state."
We also compared the state's own definitions across the window. The 2019 and 2025 report card glossaries compute chronic absenteeism the same way, chronically absent students divided by enrollment, and both exclude students who are medically homebound or hospitalized. The wording of the denominator moved from average daily enrollment to enrollment, and the 2025 glossary adds a plain-language entry restating the statute's 10 percent line. Nothing in either points to a change that could by itself double a rate.
So the number is real. The next question is why.
What the Districts Say Changed
None of the three offered a single cause, and all three put the pandemic at the center of it, less as a disease than as a change in habits.
"We have seen an increase in absenteeism since COVID," Byrne wrote, "and it seems to be more socially acceptable to miss school than it was years ago."
Damisch's answer was the longest. "I do think COVID changed the landscape in ways we are still seeing today. For many of our parents, it was the first pandemic they had ever experienced, especially as parents, and it created a new level of anxiety around illness. It also changed the workplace." Remote and hybrid work became common, "and I think our ideas about how important it is to physically 'be there' changed a little bit as a society."
District 165, Damisch wrote, "took a somewhat different approach during COVID because we opened our doors in the fall of 2020 and worked very hard to keep our kids in school. We got creative—desks were six feet apart, we put up plexiglass, changed where kids ate, limited common areas, and turned available spaces into smaller classrooms. It certainly wasn't easy, but we felt strongly that having kids in school mattered." "Even with that, I think some of the habits and thinking around attendance changed after COVID. Families seem more comfortable with children missing school than they were before the pandemic."
That is worth pausing on. A district that brought students back into its buildings in the fall of 2020, and was still holding in-person classes that November when most of the county had gone remote, still saw its chronic absenteeism rate nearly double afterward.
Grey pointed to the same shift in mindset and added one mechanism neither of the other districts raised: "the state now allows every student five 'mental health days' per year, usable at any time." Illinois began allowing students up to five excused absences a year for mental or behavioral health on January 1, 2022, with no medical note required. Because chronic absenteeism counts excused absences, a day taken under that law counts toward the 10 percent line like any other, and the State Board of Education's guidance says so in terms. Five days is under 3 percent of a school year, so the law cannot explain the increase by itself. It does mean some of the increase is by design.
Riley Is a Different Story
Riley Community Consolidated School District 18, the one-school district on Riley Road that sits inside District 154's boundary, had the lowest chronic absenteeism of any district in McHenry County in 2019, at 2.3 percent. In 2025 it was 16.7 percent, still below the state average and the lowest of the three districts here by a wide margin.
The rise looks dramatic as a percentage and should not be read that way. Riley had 255 students in 2025. Its 2019 rate works out to about seven students; its 2025 rate to about 43. Grey put it plainly: "Because we are a small school, excessive absences from even a few students significantly impact our overall attendance metrics."
Riley's truancy rate rose from 2.7 percent to 5.8 over the same period, about a fifth of the size of its absenteeism increase. When a Riley student becomes truant, Grey wrote, the district works with the McHenry County Truancy Officer, who works out of the Regional Office of Education.
The Number Inside the Number
The state also breaks chronic absenteeism out by student group, and one of those figures is the sharpest in the set.
Among low-income students at Marengo Community High School, chronic absenteeism in 2025 was 41.0 percent. Two in five. The district's overall rate was 26.3. In 2019 the low-income figure was 23.8 percent, so the gap between low-income students and the district as a whole has widened as well as risen.
At District 165 the low-income rate was 29.9 percent in 2025, against 19.6 in 2019, and unlike the high school's, its distance from the district's overall rate narrowed, from 5.8 points to 4.0. At Riley the state reports 22.8 percent, against 7.2, but Riley had 93 low-income students in 2025, so that is about 21 students, and the figure went from 34.8 percent to 17.6 in consecutive years. It is too small a group to read a trend into.
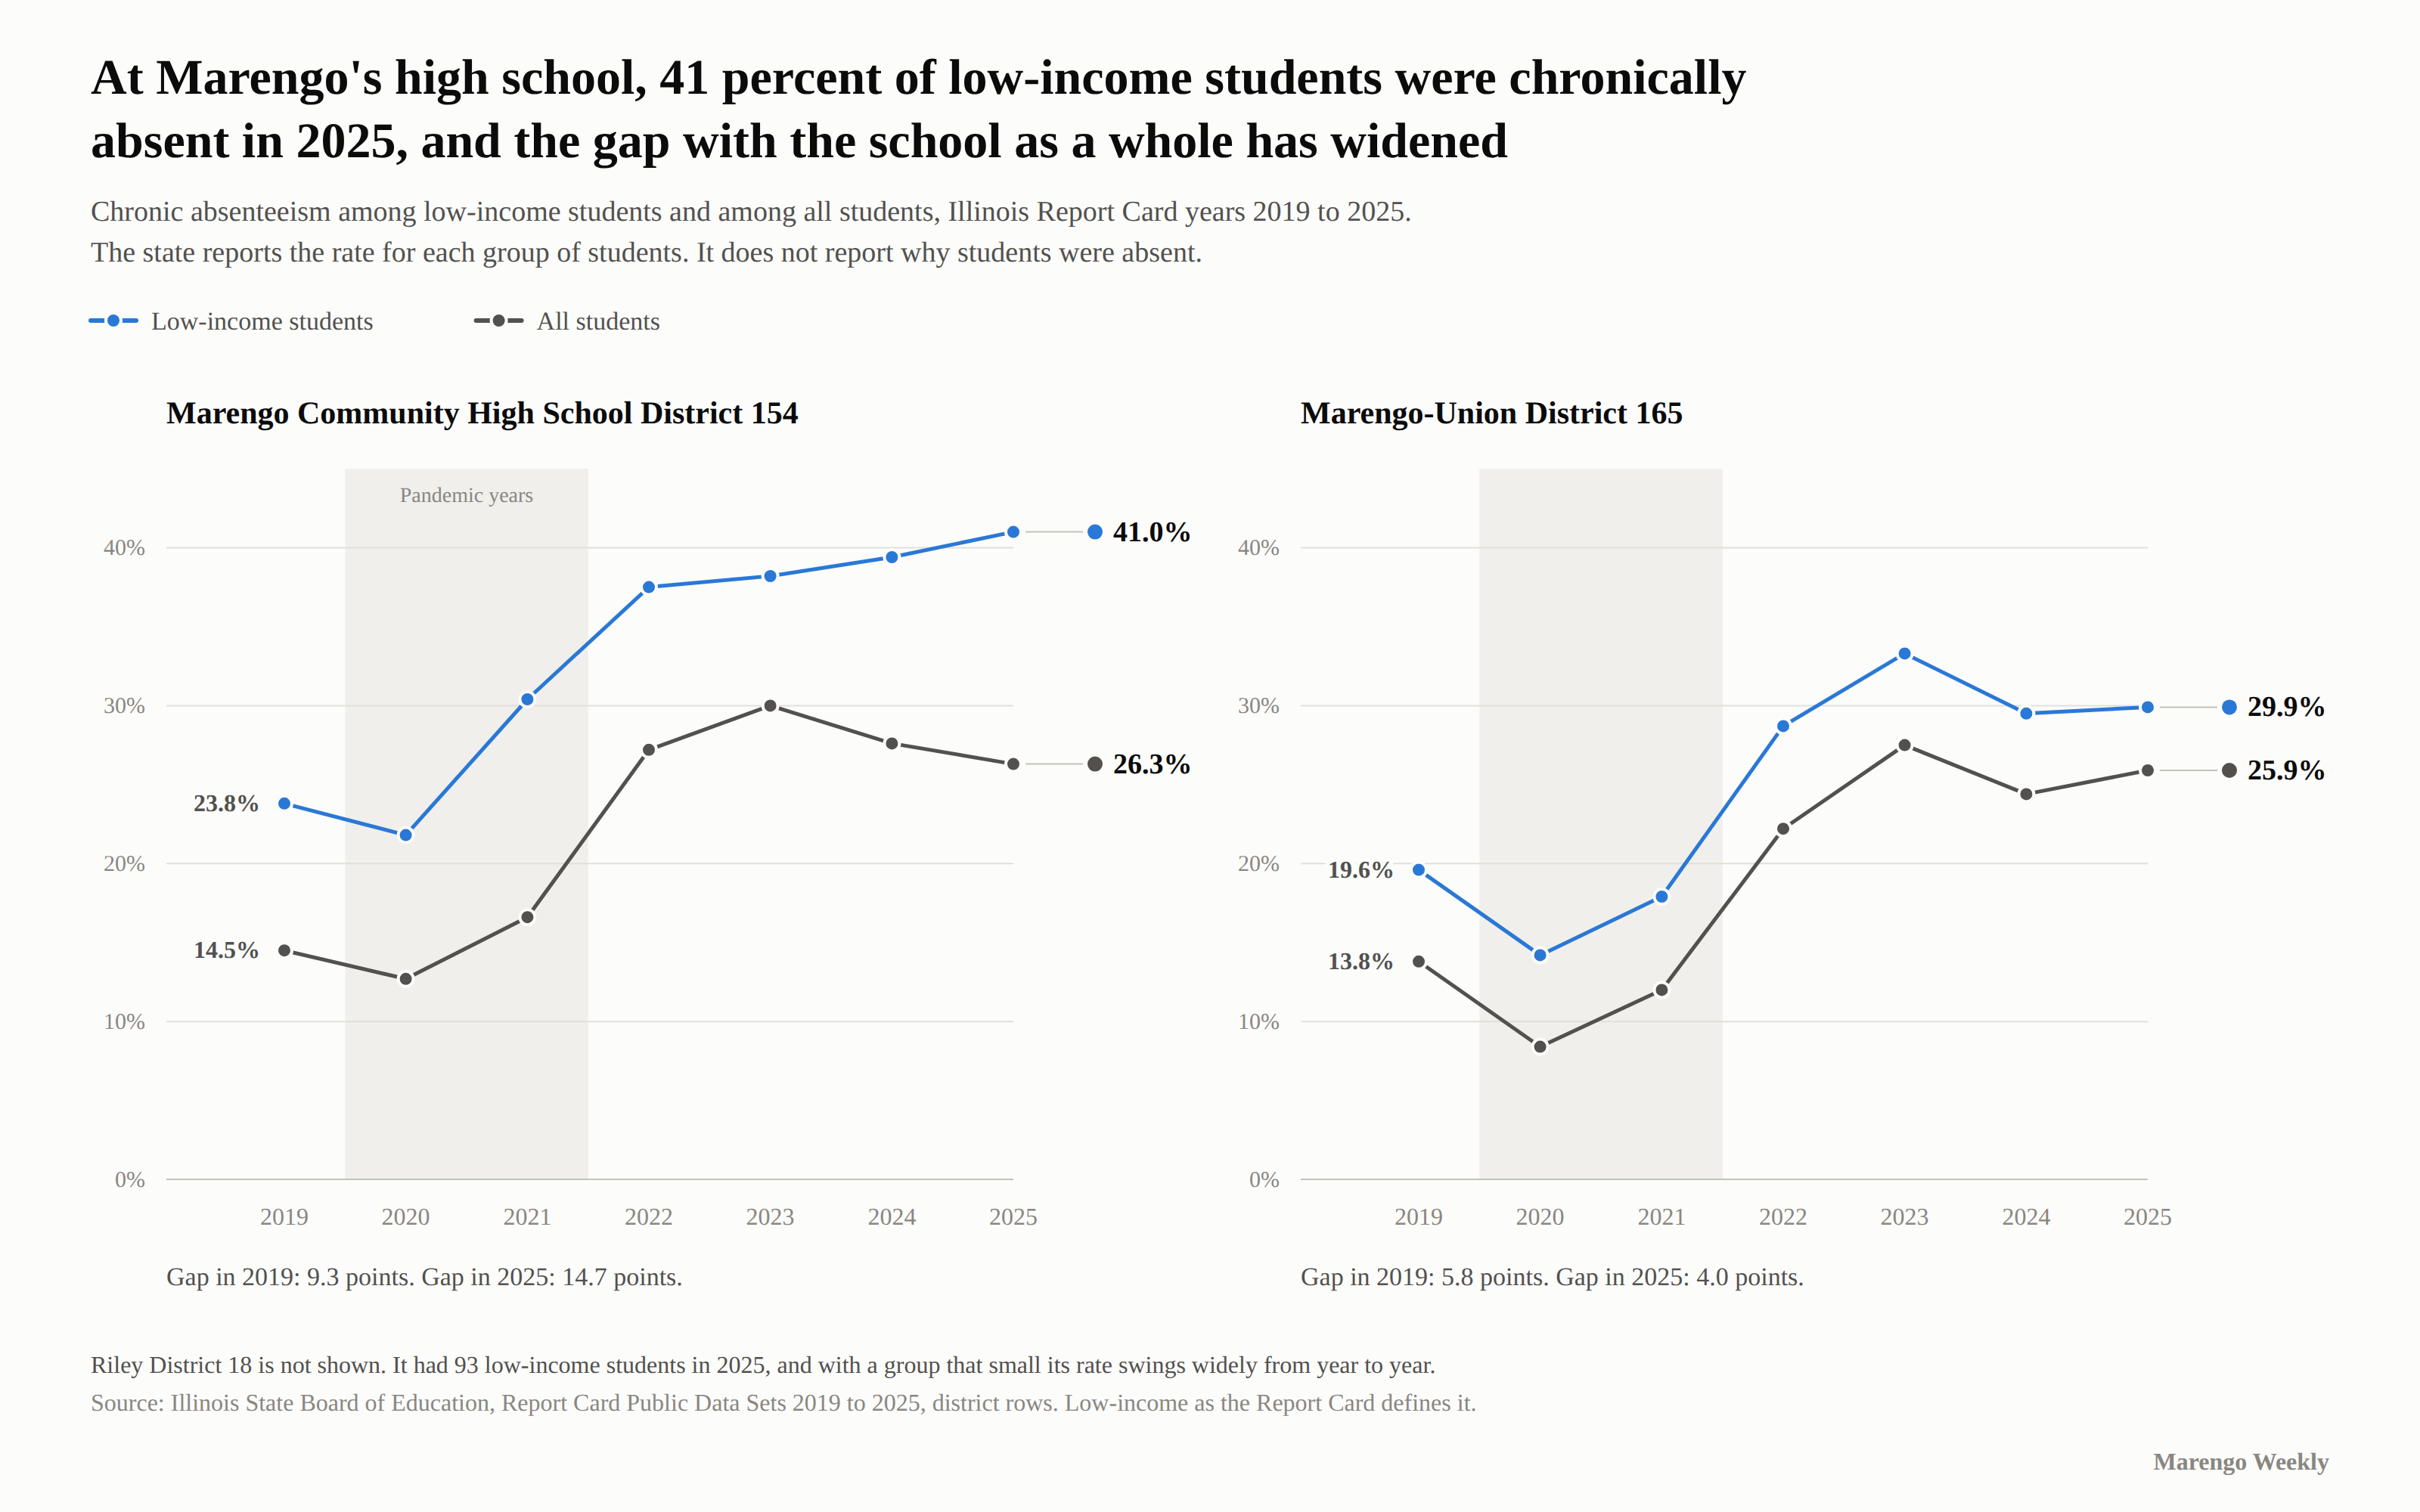
That matters more in District 165 than it would elsewhere, because the district's low-income enrollment has grown over the same period: 45.6 percent of its students were low-income in 2019, 56.0 percent in 2025. More than half the elementary district is now in the group with the higher rate.
We asked District 154 whether it tracks that gap. "We are currently examining this gap," Byrne wrote. "Our low-income students experience even more obstacles than non-low-income students. Our support staff examines all facets of our at-risk students and attempts to remove as many obstacles as possible."
We asked District 165 whether it sees the two trends as connected, and Damisch pushed back on the framing while allowing the connection. "I am always a little hesitant to use poverty as an explanation for why a child is not in school because, to me, that can start to sound like an excuse or, worse, like we are placing blame on families." Marengo, Damisch wrote, has "fewer opportunities for higher-wage employment and very limited public transportation outside of the community," and "families with fewer resources can face additional barriers." "So, yes, I think the increase in our low-income population could be one piece of the attendance picture, and research would support that there can be a connection. But I would be very reluctant to look at our numbers and simply say, 'Our poverty rate went up, so our absenteeism went up.'"
The county's own numbers bear the caution out. Harrison District 36 has nearly the same share of low-income students as District 165, 55.1 percent to 56.0, and a chronic absenteeism rate six points lower, 19.8 percent to 25.9.
We print the figures because they are the state's and they are large. We print the caution beside them because it is fair.
What Happens When a Student Crosses the Line
Districts 154 and 165 described versions of the same approach: letters home, phone calls, and a conversation before anything else.
District 154 sends a letter home for every five days of absence and follows with phone calls "to determine if we can relieve any obstacles causing a student to miss school." The tools after that, Byrne wrote, include shortened school days with a later arrival or earlier dismissal, letting students work in a private area "when anxiety becomes too extensive," transfer to the district's alternative learning program, social work, home visits and substance abuse counseling. "We try to determine methods effective for the individual student based on the obstacles they are experiencing."
District 165 sends letters as absences add up, before a student reaches the chronic line, and at the middle school the principal, assistant principal or social worker "may also pull a student aside for a quick conversation. Sometimes just showing a student how many days they have missed can be pretty eye-opening." The district is close to switching on automatic notices to families after each absence through its student information system, Skyward. "The goal really isn't to be punitive," Damisch wrote. "We want to understand what is going on and, when we can, help get the student back into a regular school routine." The approach, Damisch said, has not changed dramatically since 2019.
Riley monitors the data, shares grade-level attendance breakdowns with staff and students, celebrates perfect attendance at monthly assemblies and, as Grey put it, relies most on "open, honest communication with families as we work together to keep kids in school."
What the Superintendents Want Parents to Know
We asked Districts 154 and 165 what a parent should understand about the number that the state's figures alone would not show. The two answers point in the same direction.
Damisch wanted the two thresholds kept straight. "The 5% number is about chronic truancy—roughly 9 days missed without a valid reason. The 10% number is chronic absenteeism—roughly 18 days missed for any reason, whether those absences are excused or unexcused. And honestly, 18 days can add up faster than you think. A family vacation, a few days with the flu, a couple of appointments, and suddenly that number is getting pretty high." A high rate, Damisch wrote, does not mean "that many of our students are simply choosing not to come to school."
Byrne was more direct about where the days go. "What I want to communicate to parents is that, as a school, we wish they would be more selective when calling in absences for their students." The state, Byrne wrote, does not distinguish much between excused and unexcused when it reports non-attendance, and "every missed class period/day of school is a missed learning opportunity." The answer then listed reasons the district does not consider acceptable, and it reads like a year of phone calls to the attendance office: vacations during the school year, "sometimes lasting a week or longer, and even as long as a month"; the student's birthday; oversleeping; missing the bus; weekend sports tournaments not connected to the school; car trouble; doctor appointments with no documentation; babysitting a sibling; bad weather; family errands; getting a driver's license; heavy traffic.
Every one of those days counts toward the 10 percent line, whether the district excuses it or not.
The Office on the Ballot
One more body has a legal role in this, and its top job is on the ballot November 3. The McHenry County Regional Superintendent of Schools has a defined part in truancy under the School Code. Every quarter, school districts send the Regional Superintendent a list of students who have left school or been certified chronic truants, and the superintendent must pass it to the county's truant officer to investigate. The superintendent may report a truant minor under the Juvenile Court Act, and must send truancy data to the State Board of Education by August 15 each year. Regional Offices are also among the agencies, along with school districts and community colleges, that can win a state grant to run a Truants' Alternative and Optional Education Program. Neither McHenry County's Regional Office nor any district in the county appears in the state's directory of those programs for 2025-26.
A correction of our own belongs here. Our letters to the candidates, written from an older version of the statute, listed a January report of dropout figures among the Regional Superintendent's duties. The legislature removed that report in 2007. The answers page carries a note where it matters.
We sent the same four questions to both candidates, incumbent Diana Hartmann, a Republican, and challenger Bridget Belcastro, a Democrat, and told each that the answers would print as given. Belcastro's arrived September 18 and Hartmann's September 20. We did not share either candidate's answers with the other. Both sets are long, and both are published in full and unedited on their own page: Regional Superintendent candidates, in their own words.
The two describe the same office and disagree about what it needs. Belcastro wrote that the county has "one truancy officer for every district in the county," that this "isn't enough capacity to do more than react," and that "I'd add staffing and build better shared data between districts and the ROE so we can flag students before they reach the 10% threshold." Hartmann wrote of "a McHenry County court award-winning truancy officer" who "has truancy support within the Regional Office," that truancy referrals to the office "have decreased over the past years," and that "At this time, I do not believe we need additional truancy staff. The reason is that addressing attendance requires more than simply adding truancy officers after a student has already become chronically absent."
On the state's truancy grant program, both described it as competitive and not guaranteed. Belcastro wrote that the Regional Office "does not currently have a TAOEP program," that it "has applied for TAOEP funding in the past and wasn't awarded it," and that the next application should be built on district attendance data and on county workforce and health partners. Hartmann wrote that the grant "cannot be relied upon to sustain all of the alternative programs that have been developed to serve students in our county," that districts can create alternative programs without it, and that the Regional Office "has stepped in to provide credit recovery and alternative learning opportunities" for districts too small to run their own.
Each also said something that bears on the numbers above. Hartmann named the same state policy Riley's superintendent did: "the addition of five excused mental-health days has created confusion about how those days are understood and used." Belcastro wrote that "I'd also commit to a public, annual countywide attendance report, so residents can see the trend clearly instead of hearing about it only when a reporter pulls state data."
Voters choose between them on November 3.
Marengo Weekly reviewed the Illinois State Board of Education's Illinois Report Card figures for report card years 2019 through 2025 for the state and all 18 McHenry County school districts, and the board's 15 Year Trend Report; the 2019 and 2025 Report Card glossaries; the School Code's attendance and truancy provisions (105 ILCS 5/26-1, 26-2a, 26-3a, 26-3d, 26-15 and 26-18) and Public Acts 95-496, 100-156 and 102-321; the state board's guidance on those laws and its directories of Truants' Alternative and Optional Education Programs for 2023-24 and 2025-26; the Regional Office of Education's website; a Northwest Herald report of November 18, 2020; and written answers from Marengo Community High School District 154, Marengo-Union District 165, Riley District 18 and both candidates for Regional Superintendent. Student counts are our arithmetic from the state's rates and enrollments. The state marks its own 2020 and 2021 attendance figures "Calculated with Concerns."